SciTeens Online: Data Science Curriculums

By Shang Chen
March 10, 2021 · 2 minute read
Hello everyone, this week’s article will be a primer of sorts for the upcoming SciTeens Online Data Science curriculums. If you haven’t heard already, SciTeens Online is a week-long data science program that gives high school students the skills necessary to conduct advanced research like data exploration techniques, plotting, statistical testing, and data sorting. For students that want to learn more about Data Science as a major, check out the TL;DR Majors post on Data Science here.
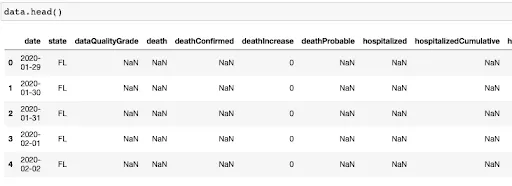
To begin our journey into data science, we’ll cover some basics like importing a dataset and creating visualizations. For a relevant dataset, we'll use open-source data about some statistics regarding COVID-19 from The Covid Tracking Project by The Atlantic. Now how do we get this dataset from the website and how might we go about analyzing this? The first step would be to read in our data and take a look at the first couple lines of it:
We’re not going to get too in-depth here in this article, but there are a variety of different sorts of analysis we could do with this dataset. We can have pandas generate some basic statistics over these columns with the .describe() command. The describe command generates a variety of interesting statistics including the mean, median, and even standard deviations of our data. If you're wondering what other sort of commands you can call, simply google pandas documentation for a complete list of the different commands and functions available for data analysis.
Since this is still a primer, we’ll keep it simple in this article and analyze the number of positive and negative cases over time from the beginning of our data set (March 2020) to the end (Jan. 2021). Let’s clean up our data to keep only the columns we want information from and filter it for points where the dataQualityGrade was an 'A'. Now let's create a line plot of negative and positive cases for the course of our data set:
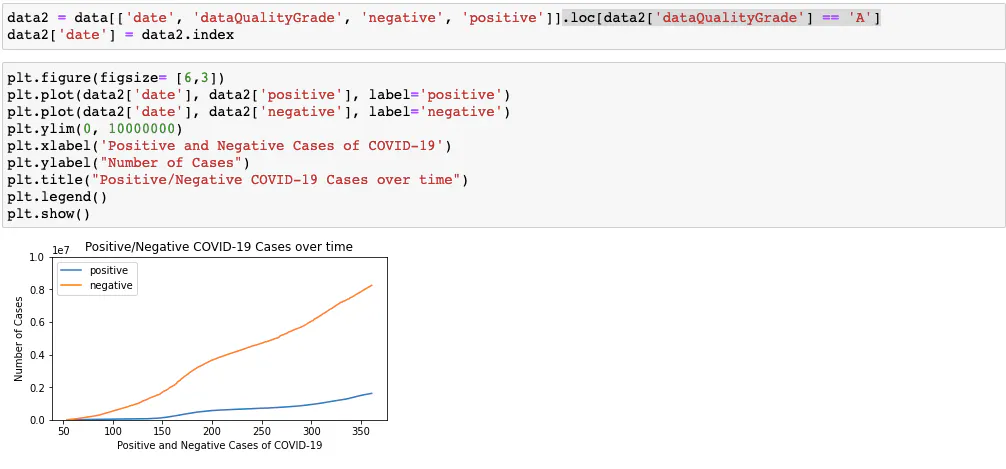
Don’t worry if you’re not completely sure about some of the commands we ran to create the graphs or filter the data. Our curriculum covers most of the basic plotting and visualization techniques you will need to do this sort of basic analysis of data for a dataset of your choosing and will give you resources to explore datasets in interesting ways.
You’ve just learned how to read in a file from a website, perform some basic exploratory analysis, and filter the data to create valuable visualizations. For more techniques and a deeper understanding of how to further break down datasets, be sure to take a look at SciTeens’ free online curriculum and check out the www.SciTeens.org website for more resources!
Did you enjoy this article?
Want to submit your own article? Reach out!
About The Author
Shang Chen is on the executive team of SciTeens and is studying Data Science and Economics at UC Berkeley. His hobbies include working out, cooking, and playing video games. Feel free to reach out to him with comments, questions, and future article recommendations at Shang@SciTeens.org.