TL;DR Guest Article: Eye color and Photophobia: The Effect on Vision in Light and Dark

By Sophia S.
April 28, 2023 · 10 minute read
Background Research:
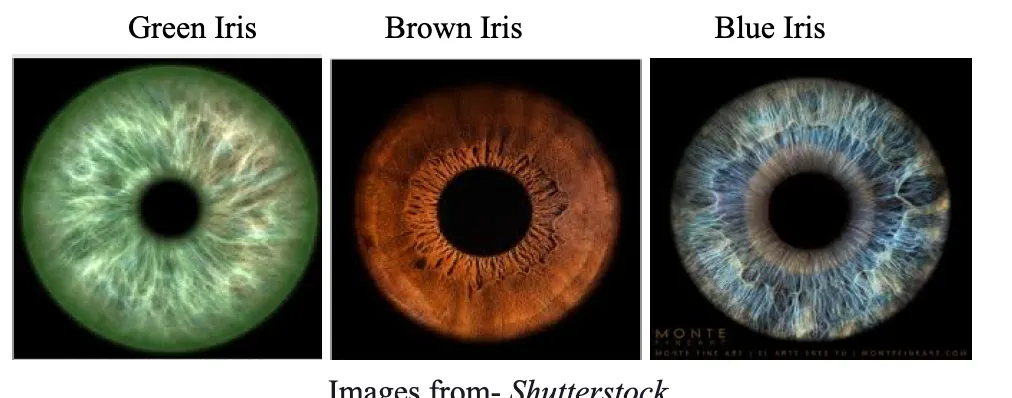
This study focuses on which eye color can see the best in the light vs which eye color can see the best in the dark. This study will help scientists understand which eye color will see the best in the light and which eye color will see the best in the dark. The most important part of this study is that eye color will impact photophobia (Mackey, 2022). This is important to figure out because vision is very important to see where everything is and vision “has a purpose upon goal-setting activities”. Eye color is very unique to each individual person “basically like a fingerprint” (Cortez, 2019). Some eye colors are darker than others and other eye colors are lighter than others. ‘Different eye colors are caused by melanin in your eye”. Melanin is what brings color into an eye. To sum it up, these are genetics which are what make people different. Eye color is genetically determined from the OCA2 gene (NEWSBREAK, 2023).
Photophobia can be caused by staring into the sunlight for too long. There are many nerves in the eye that contribute to photophobia. The nerves can relay pain signals to the brain. The trigeminal nerves are in the conjunctiva, cornea, sclera and the uvea. The trigeminal nerves are also in the iris. “The blink reflex is likely relevant to photophobia, photophobia causes an increase in blinking” (Digrie, 2012). Rods transmit information to the brain cells which can lead to photophobia. Photophobia occurs alongside migraine, whereas dry eyes do cause photophobia.
There have been no major clinical trials to fully treat photophobia. Sunglasses are the best photophobia prevention, but using sunglasses in most instances can reduce tolerance to bright lights, which can be harmful. “Treating dry eyes can treat photophobia” (Digre, 2012). If migraine prevention medication is used, photophobia is less likely to happen. Photophobia is a mechanism which evolved from the danger of directly looking into the sun. “Previous studies suggest visual photosensitivity threshold variation among healthy persons with no significant correlation between threshold and age” (Verriotto, 2017).
Photophobia is a set of recorded symptoms. A scale is necessary to determine how severe a person's photophobia is. Therefore the Utah Photophobia Symptom Impact Scale (UPSIS-17) was developed (Cortez, 2019). This scale is composed of 17 likert questions The UPSIS-17 scale was verified by testing a subject's tolerance to very bright lights.
This is when you take a light and shine it next to the subject/tester's eye (NOT directly into the subject’s eye) and show the subject the chart, followed to see how well the chart will be read by the subject. Some people report having higher vision in bright light conditions and others report having better vision in dark conditions. It is unknown if people who have photophobia see better in the light or see better in the dark.
There is no association with vision and eye color, although it is believed that people with blue eyes have a better recovery from seasonal affective disorder (Sturm, 2009). It is unknown if vision is different between eye colors, however there is some evidence that eye color affects vision in different sports.
This study will benefit society because if people do not know if they are light or dark sensitive they could get affected really badly by getting too much sun to shine in a person’s eyes or it being too dark. It is important to test this because you can help someone by giving them proper eye wear if they do not see that well.
Migraines are a serious health problem that affect many people regardless of a patient's age. The cause of migraines is not well understood, but it is well known that photophobia could contribute to migraine. Many people who have migraines report vision disturbances and discomfort in bright lights. 80% of migraine patients report photophobia during a migraine. Photophobia is so common during migraines that it can be used as a diagnosis criteria.
The pathway that relates light (photons) to photophobia symptoms is called the retino-thalamo-cortical pathway. The nerve cells in the retina relate to the thalamic trigeminovascular neurons, which then can cause migraine. This causes headaches that get worse with light, and cause a change in perception of light, words, and smells. If someone is experiencing a migraine, they find blue light, like the light emitted from electronics, to be especially painful. Symptoms such as light-headedness, dizziness, nausea, vomiting and salivation can all be caused by photophobia during a migraine (Burstein, 2019).
The relationship between photophobia and vision is not well understood. Photophobia is discomfort in pain in bright light conditions, but it's unknown if this discomfort causes lower vision. Blind people can still experience photophobia.
In Conclusion, this study is to test if subjects are light sensitive or if the subject is dark sensitive. It is very important to test if people are light sensitive or dark sensitive because if someone does not get proper eye wear/protection it can harm the subject’s eye. This will basically make everything so much better because less and less people will have problems with light sensitivity and or photophobia (Verriotto, 2017). The prevalence of photophobia in school aged students is unknown. Additionally, the effect of photophobia contributing to vision disturbances has not been well studied.
Materials
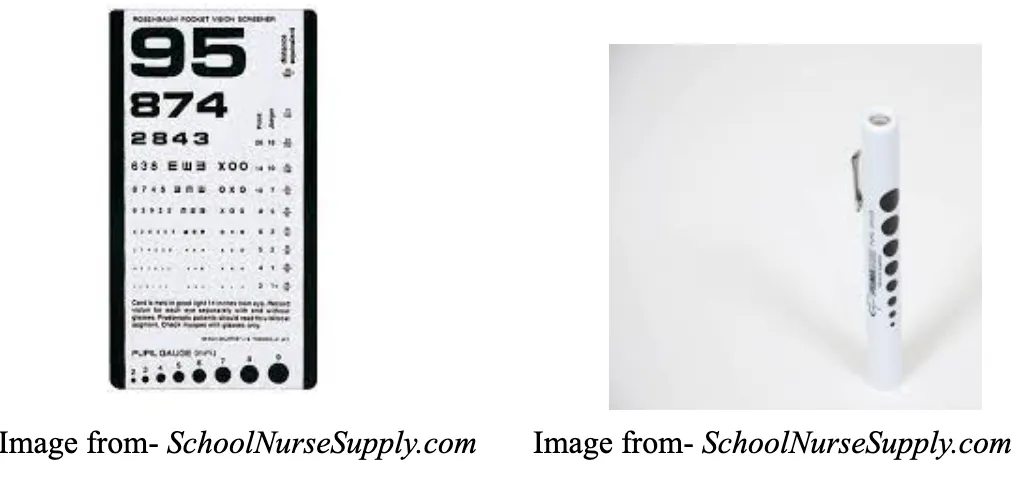
1 Rosenbaum Pocket Vision Screener
KN94 mask or KF94 mask (for every new testing day and for every subject)
1 Primacare medical diagnostic penlight
1 MacBook Air Computer ( approved by technology )
1 UPSIS-17 Photophobia Symptom Impact Scale
>75 human test subjects
Rosenbaum Pocket Vision Screener Primacare Medical Penlight Flashlight
Procedures:
- The instruments will be sterilized prior to each test subject's scheduled time .
- Covid Masking Protocols will be strictly followed according to the Los Angeles County Department of Public Health.
- Asked test subjects to take a seat(the seat was sterilized after every test subject)
- Asked test subjects name, age, eye color, and grade if applicable(subjects names were modified into identifiers that maintained confidentiality for the purpose of the investigation
- Test subject was provided a Rosenbaum Pocket Vision Screener at a distance of 14 inches away from the right shoulder of the test subject in the light
- Test subjects were then asked if they could see the first/top 3 rows of numbers and asked to read the last row of numbers aloud (if readable)
- If the test subject could not read the bottom row of numbers, the test subject was asked to read the row above it
- After the test subject reads the smallest row of numbers that are viewable, the examiner recorded which vision the test subject had according to the Rosenbaum Pocket Vision Screener
- The test subjects were then asked the level of difficulty on how they read the from the Rosenbaum Pocket Vision Screener as presented by the investigator in the light from the Primacare medical diagnostic penlight on a scale from (0-5) (0 being it was not hard to see in the light and 5 being it was hard to see in the light) Blinds remained closed for the duration of subjects tested for visual acuity in the light and in the dark.
- This aforementioned process was repeated in the dark with the Rosenbaum Pocket Vision Screener. Testing in the dark had blinds down, doors shut, and no Primacare medical diagnostic penlight was used to shine on the Rosenbaum Pocket Vision Screener.
- Test subjects were then asked a 3 question photophobia questionnaire regarding how severe their light sensitivity/ photophobia level is.
Graphs
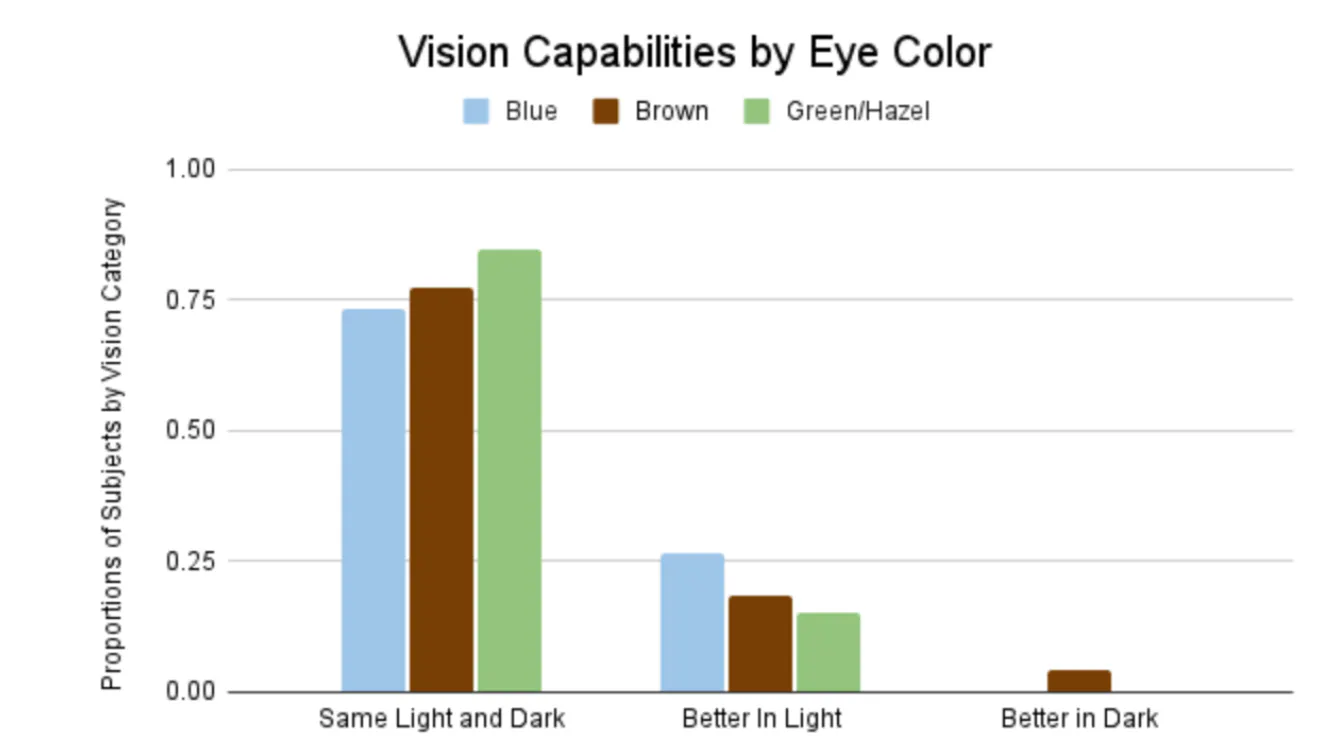
A bar chart shows the proportion of subjects who have the same vision in light and dark conditions, better vision light conditions and better vision in dark conditions by eye color. The majority of subjects had the same vision in the light and in the dark, which is true for all eye colors. Fisher’s Exact Test was used to see if the proportions of the same in dark vs light, better in light, and better in dark categories were different by eye color. Usually a Chi Square test is used, but some categories had zero people, for instance no one with green/hazel eyes or blue eyes who saw better in the dark. Therefore a Chi square test would not work and a Fisher’s exact test was used instead.
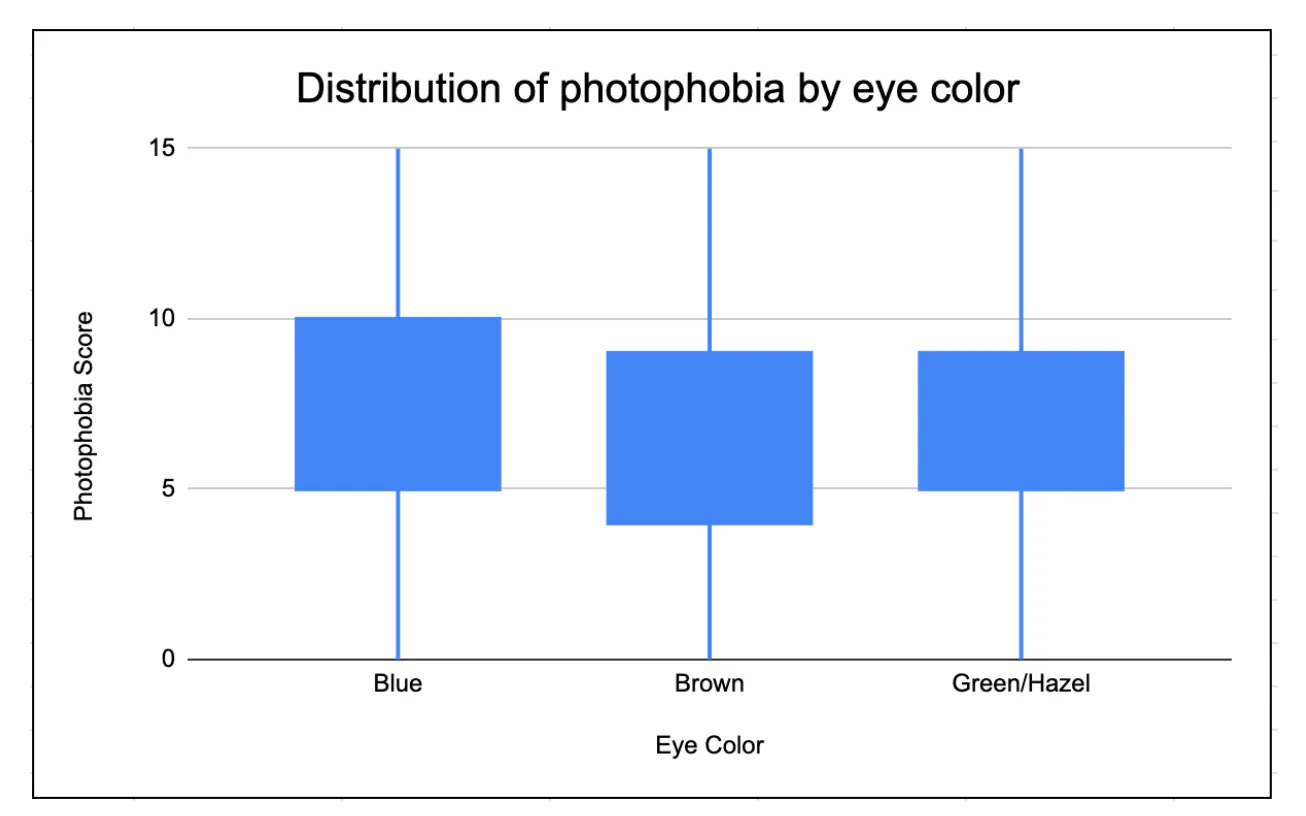
A box and whisker plot of the distribution of photophobia sum is not different between eye color. A Kruskal Wallis test was used to compare photophobia scores by eye color. The data was not normally distributed therefore the assumptions of ANOVA were violated therefore a non parametric test was used. Kruskal Wallis test impares the ranks of photophobia scores instead of the raw data.
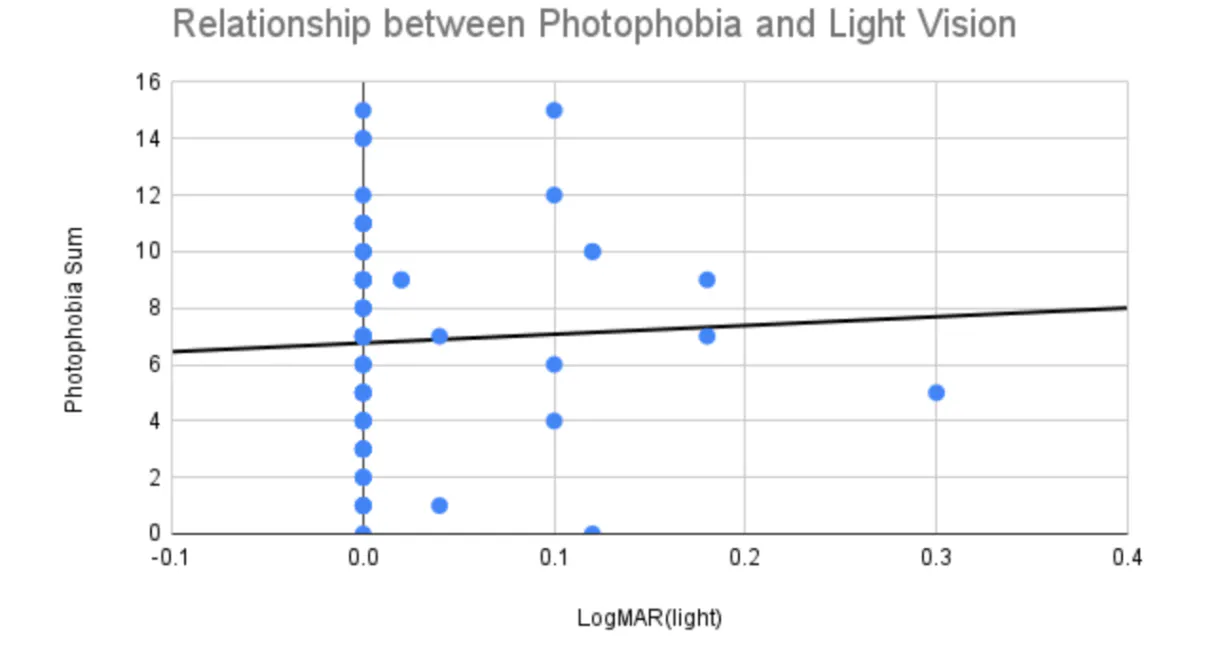
A scatter plot of photophobia sum and LogMAR shows no significant correlation between photophobia and light vision as measured by the LogMAR score. The correlation coefficient= 0.08. A Spearman’s Correlation test was used to test the association between photophobia and LogMAR. Correlation is used because both variables are continuous and there is no clear independent and dependent variable. A Spearman’s test was used instead of a Pearson’s because data was not normally distributed and Spearman’s is a non-parametric test.
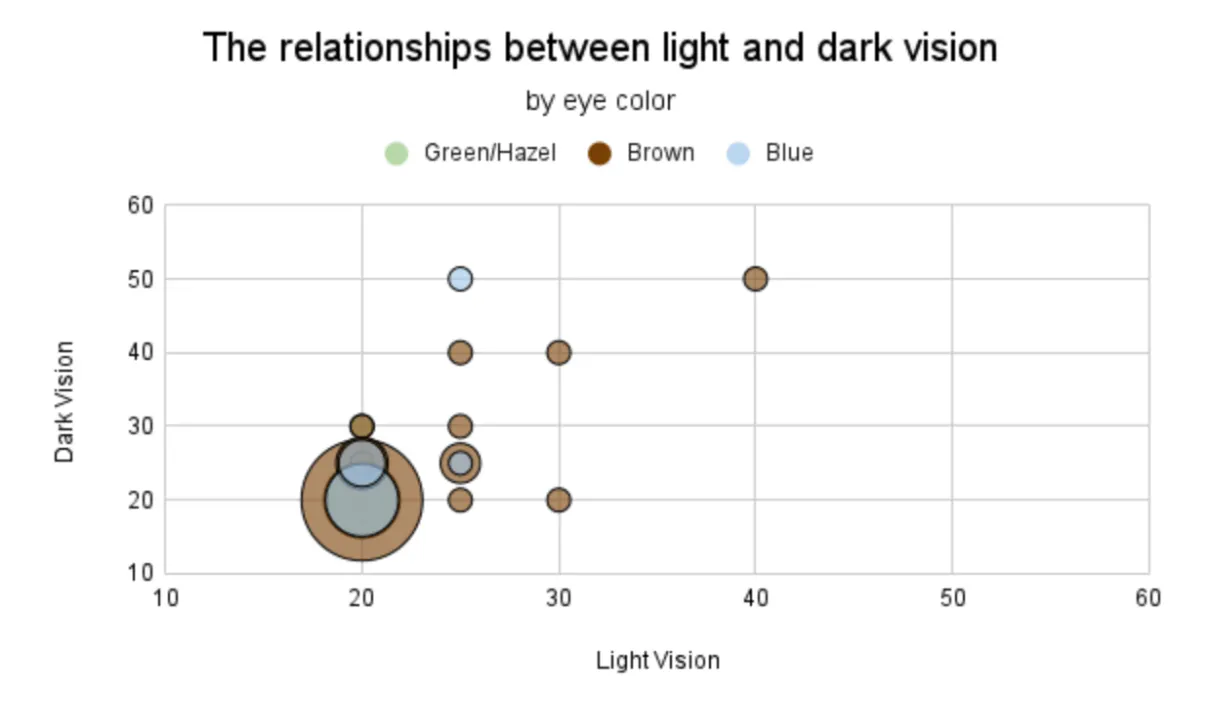
A bubble plot is shown that displays the correlation between light and dark vision where the size of the bubbles represents the number of subjects with that corresponding vision. The color of the bubbles represents the subject's eye color. 20/20 was the most common in the light and dark throughout all eye colors. Spearman’s Correlation test was used to test the association between light and dark vision. Correlation is used because both variables are continuous and there is no clear independent and dependent variable. A Spearman’s test was used instead of a Pearson’s because data was not normally distributed and Spearman’s is a non-parametric test.
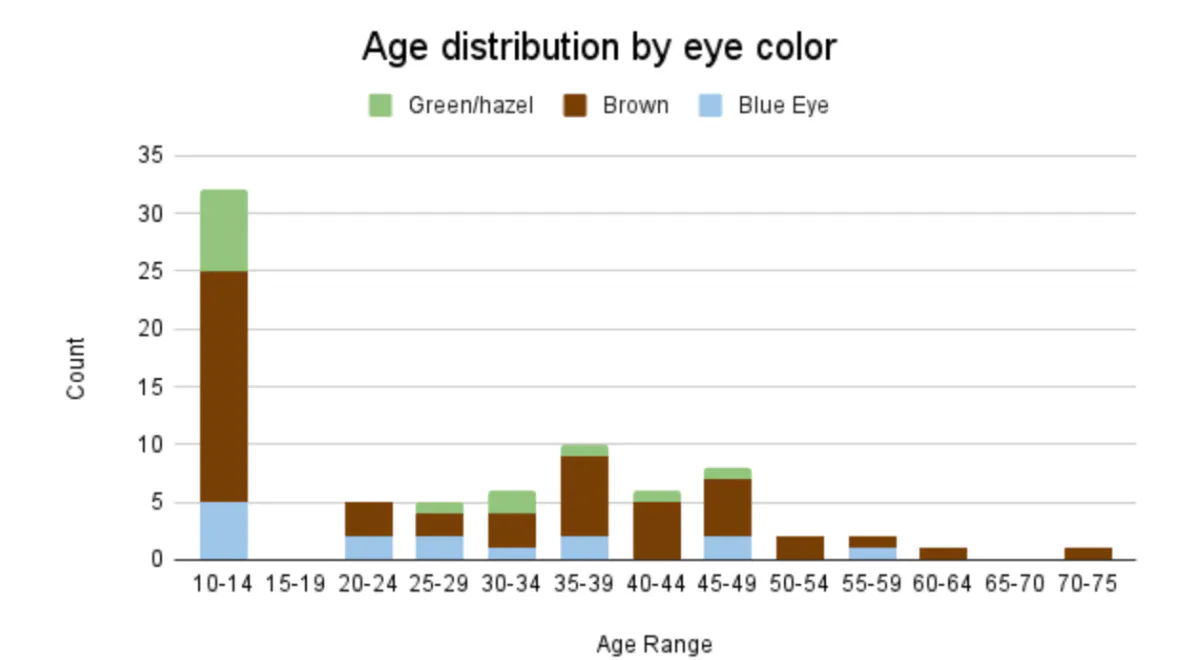
A stacked bar chart shows the distribution of age in 5 year intervals. Eye color is shown by the color of the bar. Age was not equally distributed among the study participants. Due to recruiting restraints most subjects were 10-14. No study participant was between 15-19.
Data/Observations/Results:
The study recorded the vision of 78 participants. 15 people (19%) had Blue eyes, 50 people (64%) had Brown eyes, 13 people (17%) had Hazel/green eyes. Most participants had 20/20 vision in light and dark. Light vision and dark vision were highly correlated (Spearman’s Rho correlation coefficient=0.56, p<0.001). This correlation was similarly high in all eye colors. The LogMAR of light vision and dark vision was compared and 19.5% of subjects saw better in the light conditions vs dark conditions. 2.6% of participants saw better in dark conditions vs light conditions. The remainder of participants had an equal vision in the light and the dark.
The photophobia total score ranged from 0-15(0=no light sensitivity and 15= high light sensitivity). The median photophobia score was 7 and the mode photophobia score was 7. The inter quartile range was 4-9. Photophobia was not different by eye color (Kruskal Wallis p=0.7264). Spearman’s correlation testing was performed on the photophobia score and light vision. Surprisingly there was no correlation between photophobia and light vision (Spearman’s Rho= 0.08, p=0.4610).
Conclusion:
Eye color was not related to light vision, dark vision, or photophobia. The correlation between light and dark vision was very strong. Most people saw the same in the light and the dark, but more people had better vision in the light. When vision was not the same in light and dark most people saw better in the light.
Discussion:
Light sensitivity causes eye strain and eye discomfort therefore it is logical to believe that high photophobia would be highly correlated with lower vision in a light environment. However, this study did not detect any correlation between photophobia and light vision. This represents that photophobia is statistically independent from light vision in this population. This study did not detect any differences between vision and photophobia by eye color. Therefore the null hypothesis is not rejected. Additionally, the relationship between vision and photophobia was similar between eye colors. This study did meet the enrollment target, but there was not enough statistical power to discern between eye colors. The majority of people in this study had Brown eyes, which resulted in less statistical power.
Age is a major contributing factor to vision. So ideally statistical models are how you control for age. However non-parametric unadjusted analysis had to be conducted due to non normal vision distributions. A sensitivity analysis was performed where all tests were conducted in students only and staff only. This sensitivity analysis showed similar results in both sub-populations. Light and Dark vision was very strongly correlated,statistical tests show significance. This result points to high precision compared to testing procedures. Most participants had equally good vision in the light and the dark. 2 test subjects had better dark vision than light vision whereas 15 test subjects saw better in the light and 61 saw the same in the light and the dark. This result was consistent throughout all eye colors. Due to logistical constraints all participants needed to have access to the approved experimental facility. Therefore the age distribution of this study did not match the larger population; most participants were between 10-14 years old. Vision and photophobia both change with age. (Digre & Brennan, 2012). Therefore future studies should be conducted with an older population. Due to scheduling limitations potential test subjects under the age of 10 were not able to participate. Many study participants for corrected vision wore either glasses or contacts and therefore most participants had 20/20 vision.
Sources:
- Cortez MM.. Validation of a photophobia symptom impact scale. Cephalalgia. 2019 Oct;39(11); 1445-1454
- Digre KB and Brennan KC. Shedding light on photophobia. Journal of Neuro-Ophthalmology 2012;32:68-81
- Mackey DA.. What color are your eyes? Teaching the genetics of eye color & color vision. Eye. 2022 Apr; 36(4): 704-715.
- Mackey DA. Classification of Iris color:review and refinement of a classification schema. Clin Exp Ophthalmol. 2011;39:462-71.
- Verriotto JD. New Methods of Quantification of Visual Photosensitivity Threshold and Symptoms. Transl Vis Sci Technol. 2017 Jul;6(4):18
- Roy, E. (2023, February 24). Blue-eyed humans have a single common ancestor. NewsBreak. Retrieved February 26, 2023, from https://www.newsbreak.com/news/2936172299737-blue-eyed-humans-have-a-single-common-ancestor?noAds=1&_f=app_share&s=i3
- Sturm, R.A. and Larsson, M. (2009), Genetics of human iris colour and patterns. Pigment Cell & Melanoma Research, 22: 544-562. https://doi.org/10.1111/j.1755-148X.2009.00606.x
- Burstein, R., Noseda, R., & Fulton, A. B. (2019). Neurobiology of photophobia. Journal of Neuro-Ophthalmology, 39(1), 94–102. https://doi.org/10.1097/wno.0000000000000766
- Kikkeri, N. S. (2022, December 6). Migraine with aura - statpearls - NCBI bookshelf. Migraine with Aura . Retrieved February 26, 2023, from https://www.ncbi.nlm.nih.gov/books/NBK554611/
Did you enjoy this article?
Want to submit your own article? Reach out!
About The Author
Hello! My name is Sophia Spencer. I am a 6th grader at Mirman School in Los Angeles. Next year I will be starting middle school at Brentwood School. This year I competed in the 73rd Los Angeles County Science & Engineering Fair. I really enjoy doing science and my dream is to become a scientist. Furthermore, I am very interested in studying the eye, so my scientific study evaluated the relationship between Eye color and Photophobia. The idea for this study came from playing tennis. I am a competitive tennis player and noticed some people have difficulty seeing the ball better in the dark whereas other players see the ball better in the light.