TL;DR Science: Causation vs Correlation (Part 1)

By Shang Chen
September 23, 2020 · 4 minute read
Today we'll be tackling a crucial topic that many high school statistics students struggle to understand. Often, when students look and analyze data, they fall into the trap of concluding that correlation is equivalent to causation. Misinterpreting the data in this way can lead to results with comical to dangerous consequences. In this article, we'll take a look at an example of correlation not equal to causation and end this post with a quick overview of how you can come to causal conclusions.
What does it mean that variables are correlated with each other?
Correlation is the relationship between two variables.
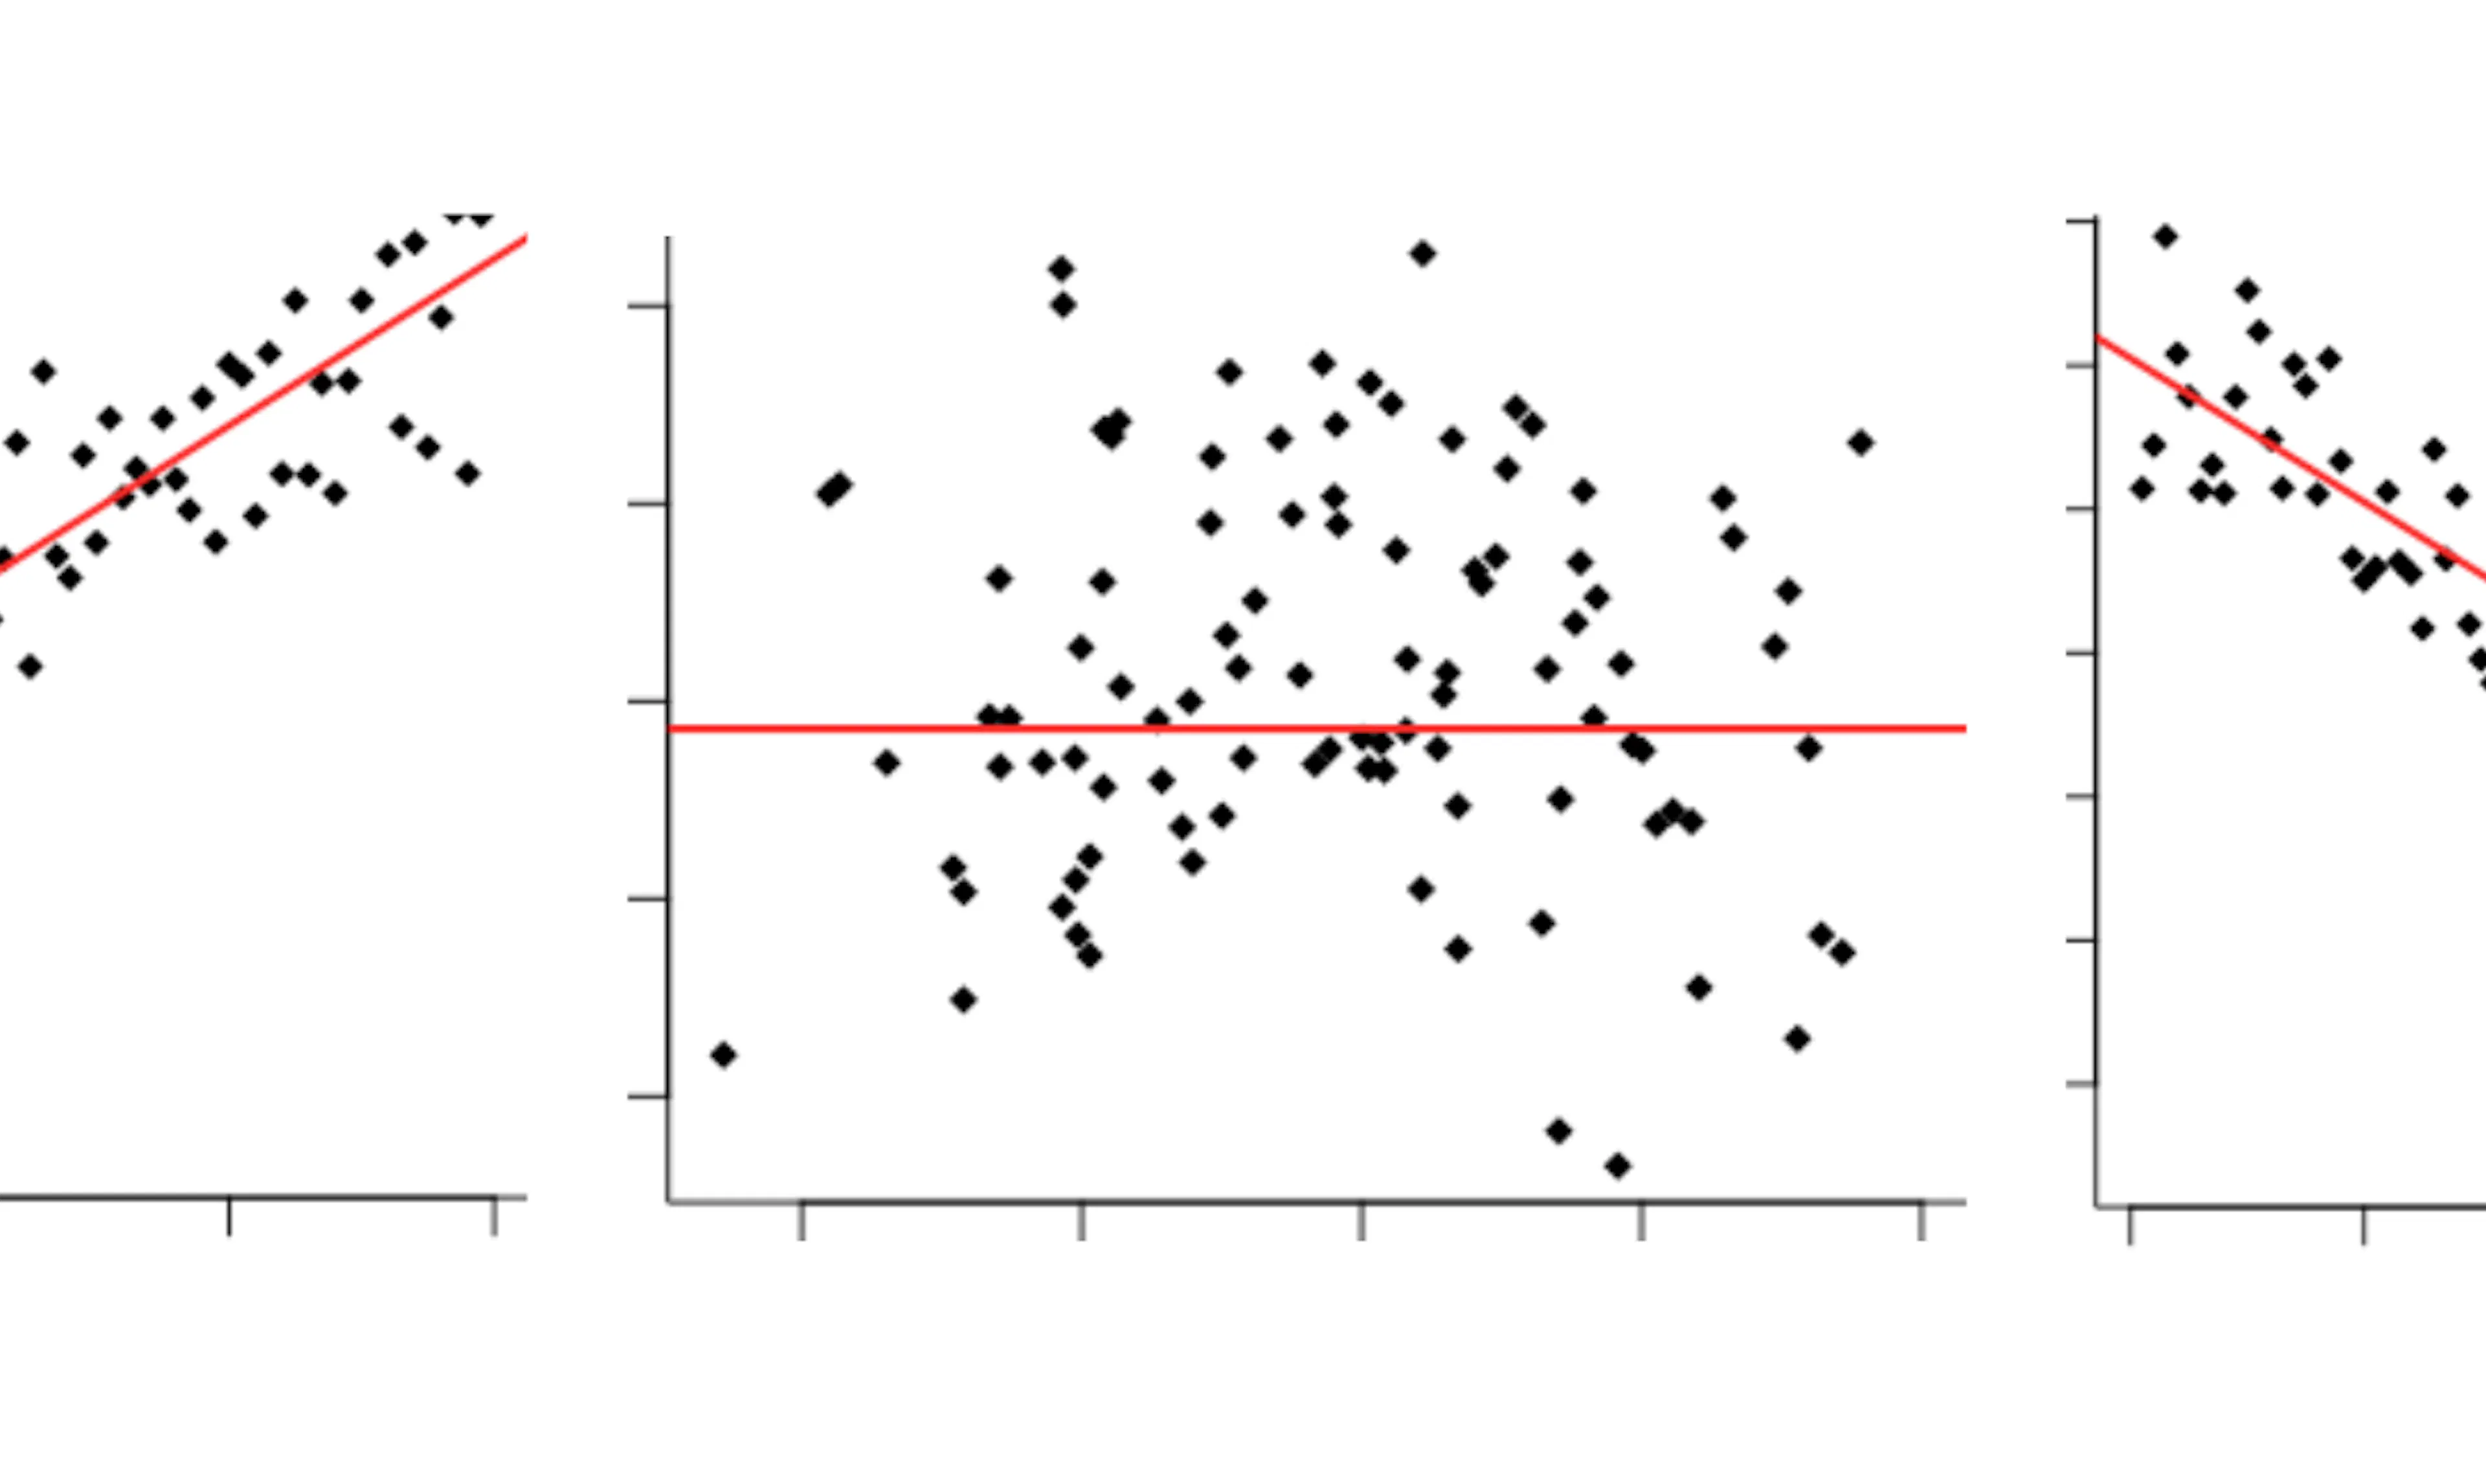
In more mathematical terms, if we have the equation y=mx+b, if y increases when x increases, then we can say that x is directly correlated with y. On the other hand, if x increases and y decreases, we would say that the variables are negatively correlated.
Examples of a direct correlation could be things like your chances of getting wet if it's raining outside. Chances are, if it is raining outside, then you will get wet (unless you have an umbrella, of course). Likewise, a negative correlation could be your chances of staying dry if it's already raining outside.
It's important to realize that even in our simple examples, just because it is raining outside does not mean you will get wet. All we are saying is that the chances of you getting wet are higher when it's raining. But now you might be asking me, isn't it the rain that makes you get wet? Therefore, isn't the rain causing you to get wet? You might be right in this case, but the important thing to remember is that even if x (raining) results in y (you getting wet), we cannot infer a cause and effect relationship from a correlation.
The difference between correlation and causation might be a little confusing for some of you, so we'll look at another example with some graphics this time. Usually, the way we depict the relationships between two variables is through a graph. Many of you may have recognized the equation I gave earlier as the slope-intercept form of a line.
Modeling data through graphs is a common way of seeing the correlation between two or more variables.
Take this graph, for example:
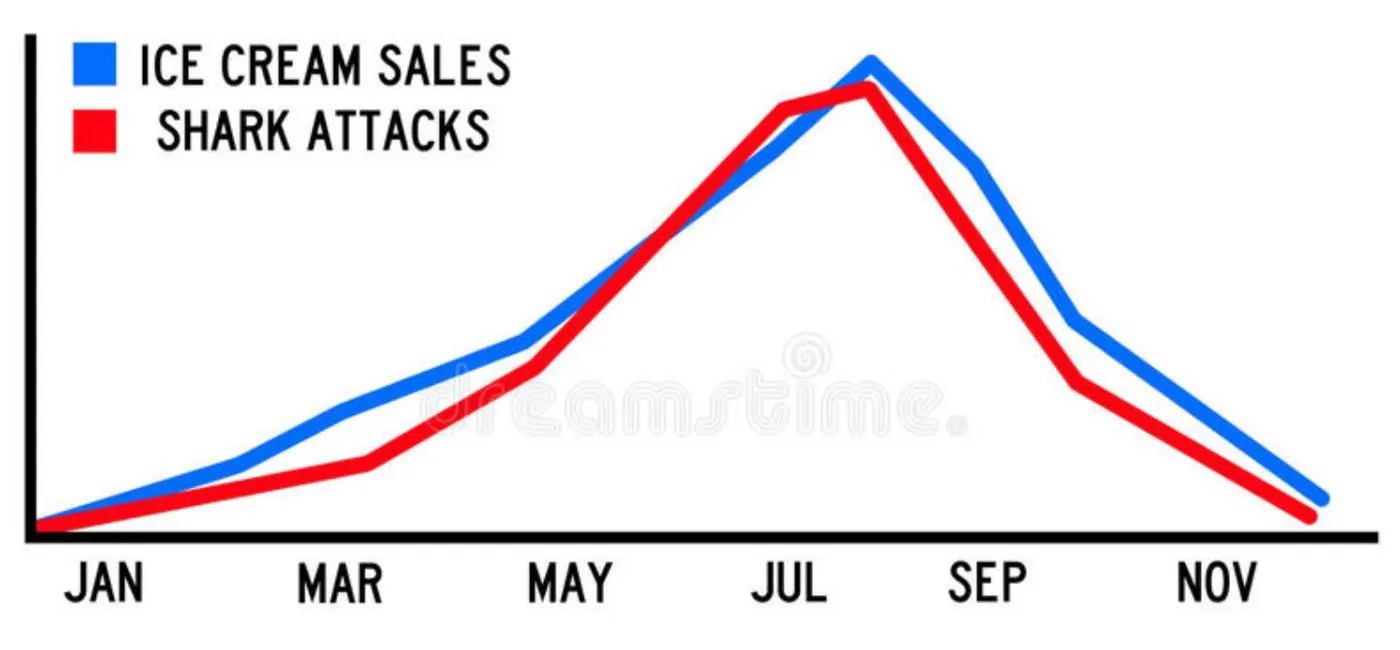
We can see two lines, the sales of ice cream in blue, and the number of shark attacks in red. At first glance, it seems that both of these two lines are directly correlated with each other. When the red line increases, so does the blue line, and when the blue line falls, so does the red line.
Does this mean that consuming ice cream will increase the chance of you being attacked by a shark?
The obvious answer is no; they have nothing to do with each other. It's not like sharks can sense high blood sugar and attack people who enjoy sweets at a disproportionate rate. So what gives then? Is the data just wrong then? Not really, you see the issue with correlation-based graphs is that while they may show the relationship between two variables, in a lot of cases, the world is a lot more complicated than we can model it. In our shark attack vs. ice cream example, can you think of another variable that would better explain the relationship between the red and blue lines?
One variable could be the number of people on the beach. As we see in the graph, shark attacks peak around the hottest months in the summer. Likewise, we would also see a pretty similar relationship between shark attacks and the average temperature of the months. Now we can see a better picture of the data; sharks don't attack more people when they eat ice cream - they attack more people when more people are swimming in the ocean - period. The number of shark attacks goes down in the winter months when people are less likely to be in the sea and more likely when there are many surfers and unsuspecting swimmers that might be mistaken as food.
Okay, if correlation doesn't mean causation, how do we establish causality?
We just saw that the results of your data and graphs could be misinterpreted, so how can we avoid coming to the wrong conclusion when working with our own data sets? The different methods scientists use to establish causality will be discussed in next week's article, so stay tuned.
TL;DR
Correlation is the relationship between two variables. Two variables positively correlated, negatively correlated, or have no association with each other at all (i.e., your chances of winning the lottery if you ate oatmeal that morning). Correlation relationships are often depicted through graphs and models, but it's necessary to look for other variables that may have been left out of the analysis.
Make sure to us on Instagram, Facebook, and YouTube to stay up to date with our videos, articles, and other resources that we release weekly.
Did you enjoy this article?
Want to submit your own article? Reach out!
About The Author
Shang Chen is on the executive team of SciTeens and is studying Data Science and Economics at UC Berkeley. His hobbies include working out, cooking, and being bad at chess. Feel free to reach out to him with comments, questions, and future article recommendations at Shang@SciTeens.org.