TL;DR Science: Statistical Testing
By John Sutor
June 03, 2020 · 8 minute read

I bet you didn’t know that over 75% of statistics are made up. Hopefully, you don’t take our word on that statistic, but we do hope you take our word on when and how to use statistical tests within your research. After all, numbers don’t lie (except for our own made-up statistic). Having the ability to conduct and interpret the results of statistical tests will allow you to set yourself apart from your peers when it comes to the science fair or research conferences, so let’s get started towards an overview of these great tests.
What are Statistical Tests?
Statistical tests are tests used by scientists in order to make inferences about data. These tests will allow you to numerically prove the significance of your findings. These tests range from proving a correlation between two variables to how much the means of two similar populations differ. Whereas more rudimentary statistics such as the mean, median, and mode allow you to explain your data at a glance, statistical tests will allow you to examine the importance and validity of the results of your experiment
When Should I Use Statistical Tests?
Statistical tests are used on a case-by-case basis depending on what you are trying to prove in your research. Different use cases include examining the regression of two or more variables, comparing the correlation between two variables, and comparing the means between two variables. These tests allow us to test our own hypotheses, where the base hypothesis is referred to as the Null Hypothesis. The null hypothesis simply says that nothing is different about the two bodies of data that you are testing. For example, if you were comparing the average heights between males and females, your null hypothesis would simply state that there is no difference between the average height of males and females. This hypothesis is typically referred to as “H0”. The Alternate Hypothesis is the hypothesis that, quite simply, is the alternative to the Null Hypothesis. Even though this is a circular definition, it’s easier to explain than to define. For our case comparing the average height between males and females, our alternate hypothesis would simply state that there is a difference between the average height of males and females. The Alternate Hypothesis is referred to by “H1”.
The Null Hypothesis and the Alternate Hypothesis are all dandy for explaining what we’re looking to prove via statistical testing, but how do we actually go about testing if the Null or Alternate Hypothesis is true? May I introduce to you now, the esteemed p-value. This value allows us to test whether we should fail to reject or reject the Null Hypothesis based on how it compares to a Significance Level. The significance level is typically set at the value 0.05. If the test that we choose to use returns a p-value greater than the significance level, we fail to reject the Null Hypothesis. On the other hand, if the p-value is less than or equal to the significance level, we can reject the Null Hypothesis in favor of the Alternate Hypothesis. In simpler terms, if p > 0.05, we fail to reject H0. If p <= 0.05, we reject H0 in favor of H1.
Wow, that was all a mouthful. There’s nothing quite like being thrown a million new stats terms in two paragraphs, huh? It’s okay if you’re a bit overwhelmed by all of this, and if you need to explore this information in a bit more detail, we recommend you check out the sources that we’ve provided below. Without further ado, we’ll explain how to get to work using different statistical tests to either reject or fail to reject your H0. Please note that we randomly generated the data below.
Regression
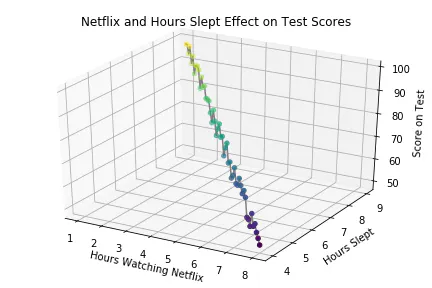
Possibly the simplest to understand, a regression allows us to examine the relationship between an independent and a dependent variable. The simplest form of regression is the aptly named Simple Linear Regression. This type of regression looks to see if there is a linear relationship between two variables. For example, we could perform a research project that explores the number of hours spent binging Netflix the night before a test, and the resulting test score obtained the next day for a sample population. We may find that for every additional hour spent watching Netflix, our research subjects drop 10 points in their test score. This is a linear relationship, and performing a Simple Linear Regression would allow us to see if there is in fact a significant relationship between the independent variable (number of hours watching Netflix) and the dependent variable (test score the next day). If we receive a p-value of less than or equal to 0.05, we can safely reject our Null Hypothesis that there is no relationship between the number of hours spent watching Netflix the night before an exam and the resulting test score.

Multiple Linear Regression explores how multiple independent variables affect one dependent variable via a linear relationship. For example, we may choose to record the number of hours that our subjects sleep the night before the test in addition to the number of hours they spent watching Netflix. Then, performing a Multiple Linear Regression, we can determine whether there is a linear relationship between all three variables. If we obtain a p-value less than or equal to 0.05, we can conclude that there is a significant relationship between the number of hours spent watching Netflix, the number of hours slept, and the resulting test scores the next day.
In research, you’ll likely find many cases where there isn’t a linear relationship between data. Not to fear, you can instead use different forms of regression. The easiest way to determine what type of regression to use for your data is to plot your data (we discuss here how to make figures if you’re unsure of the best practices of doing so). Once you can visualize your data, it’s easy to determine whether you should use a Linear Regression, a Logarithmic Regression, an Exponential Regression, or any other type of applicable regression.
Correlation Testing
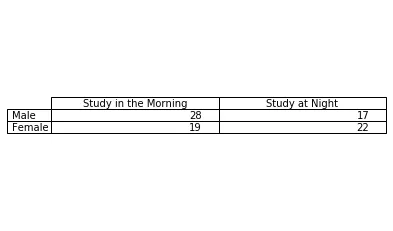
Next, we’ll discuss how to test for a correlation between two variables. The correlation between two variables is simply how related those two variables are. A common form of correlation testing is the Chi-Square Test of Independence. This simply measures the strength of the association of two categorical variables. For example, our study could try and measure whether there is a significant difference between the study times of men and women. We could classify our test subjects into four different groups: Whether they study in the morning or in the afternoon, and whether they are male and female. If we perform a Chi-Squared Test of Independence between the two tests and receive a p-value less than or equal to 0.05, we may conclude that there is a significant difference between the study preferences of men and women. For more tips on how to conduct a Chi-Squared Test of Independence, check out the links below.
Comparison of Means
Another very common test is a comparison of means test. This examines how the average value of two variables compare. A common form of means testing is a T-Test. The two most common types of T-Tests are the Paired T-Test and the Independent T-Test.
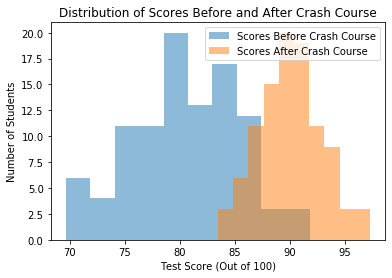
The Paired T-Test examines the difference between two variables from the same population. Say we had a research project that aimed to examine how test-takers performed before and after watching YouTube Crash Course videos for an hour. We could administer a test to our population before watching the videos and then again after the videos. We could then record the average test scores of the students before watching the videos and after watching the videos. With this information, we could then conduct a Paired T-Test to determine whether there is a significant difference in the average score of students before and after watching the videos. If we receive a p-value of less than or equal to 0.05 after conducting the test, we can say that there is indeed a difference in the performance of the students before and after watching the crash courses and taking the test.
The Independent T-Test examines the difference in the same variable in two different groups. Say we wanted to explore the difference in the height of Pinto Bean plants and Black Bean plants at maturity. We could measure the height of a large number of Pinto Bean plants, and then measure the same amount of Black Bean plant heights as well. Afterward, we can record the average height of both of the populations. After conducting an Independent T-Test on our data, we can decide whether or not there is a significant difference in the average heights of the two plants based on the p-value that we obtain.

TL;DR
Statistical testing allows us to determine the significance of the results we obtained through experimentation. We start with a Null Hypothesis and then determine whether we fail to reject or reject the Null Hypothesis based on the p-value we obtain from statistical testing. Some of the most common forms of statistical tests are regressions, correlation tests, and comparison of means tests. The ability to conduct such tests will set your science fair or research project from the rest, and will thoroughly impress judges and readers.
Sources
List of the different types of statistical tests:
https://cyfar.org/types-statistical-tests
When to use each statistical test:
Explanation of hypothesis testing:
https://machinelearningmastery.com/statistical-hypothesis-tests/
Video on hypothesis testing:
Video on performing a Chi-Square test:
Video on conducting a two-sample T-Test:
Video on Linear Regression:
Did you enjoy this article?
Want to submit your own article? Reach out!