TL;DR Math: The Normal Distribution

By Thomas P.
January 06, 2023 · 4 minute read

The Basics
Statistics is the application of math; a way of organizing and putting data into perspective. One way we can organize data is by putting the numbers on a number line and finding the number in the middle of the line. We might call this value the average or the mean, which is calculated by dividing the sum of the numbers (or “terms”) by the number of terms.
Sample Mean or x̄ = sum of terms/number of terms (x̄ = sample mean, µ = population/expected mean)
Similarly, one can find how far (on average) each value on that number line is from the mean. This would be a measure of how spread out the number line is from the minimum value at the left end to the maximum value at the other. This measure is called the standard deviation (deviation means in this instance distance from the mean).

Because the calculation of standard deviation is typically quite tedious, it is normal to use a calculator to complete it.
It may not be especially obvious how these two measures are so interconnected yet also ubiquitously useful in statistics. Let me assure you, however, these two measures are fundamental to understanding the rest of statistics.
Example:
I computed the following data set in my TI-nSpire:
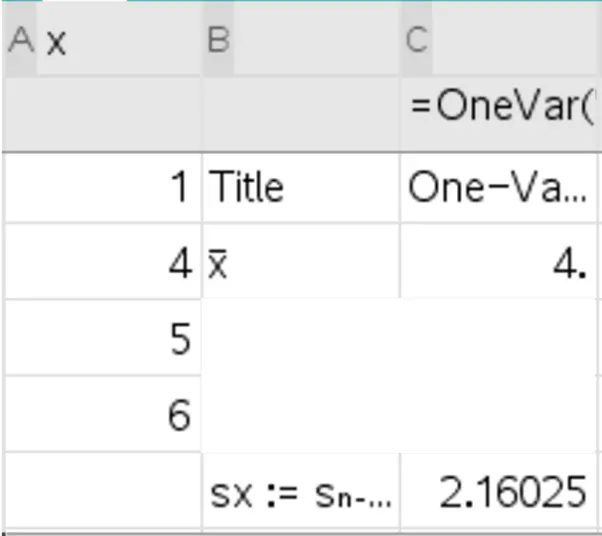
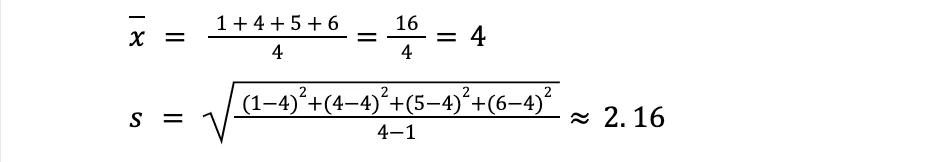
In this example, we have a sample called x of four numbers - 1, 4, 5, and 6. Here are the calculations of standard deviation and mean worked out:
The Normal Distribution
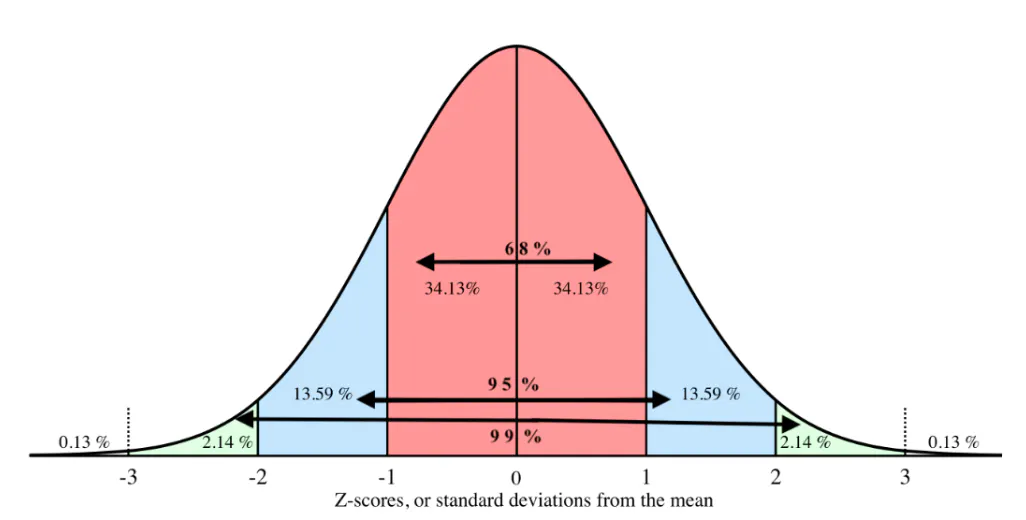
The Normal Distribution is a known phenomenon (probability distribution of data) that occurs in some instances. Note that the normal distribution does not occur in all data sets; examples of where it occurs includes data about heights or weights. The probability distribution of the normal distribution as follows
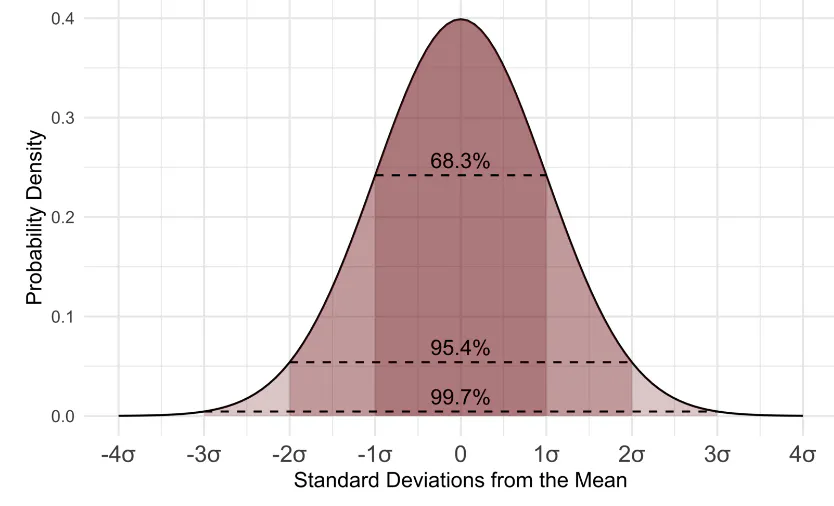
Attribution: Wikimedia Commons, D Wells
- ~68% of observations should be between one standard deviation from the mean.
- ~95% of the observations should be between two standard deviations from the mean.
- ~99% of the observations should be between three standard deviations from the mean.
Z-Scores
By using the Normal distribution we can infer how much of the data is above or below the value. We can do this by using standard score (z-score), which can be used to compare data on one side of the distribution to data on the other. For example, data that is at a z-score of -1 is going to be closer to the mean than a z-score of 2.5.
Z = (data value - mean value) / standard deviation
Or,

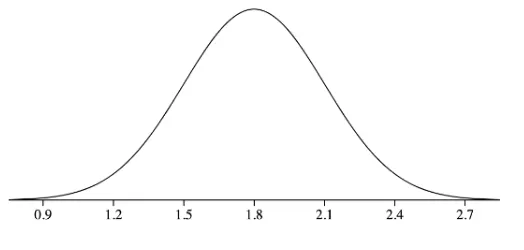
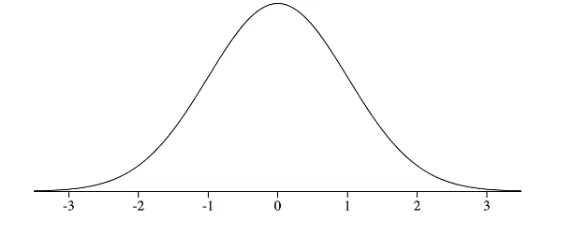
To clarify, the normal distribution does not need to have a mean of 0 and a standard deviation of 1 in order for its values to be fitted into z-scores. The above formula automatically standardizes all of the values into a normal distribution with a mean of 0 and a standard deviation of 1. For example, if we have a normal distribution of heights with a mean of 1.8 meters and a standard deviation of .3 meters, we could calculate the z-scores for all of our data points and turn this…
Into this…
Applying the normal distribution
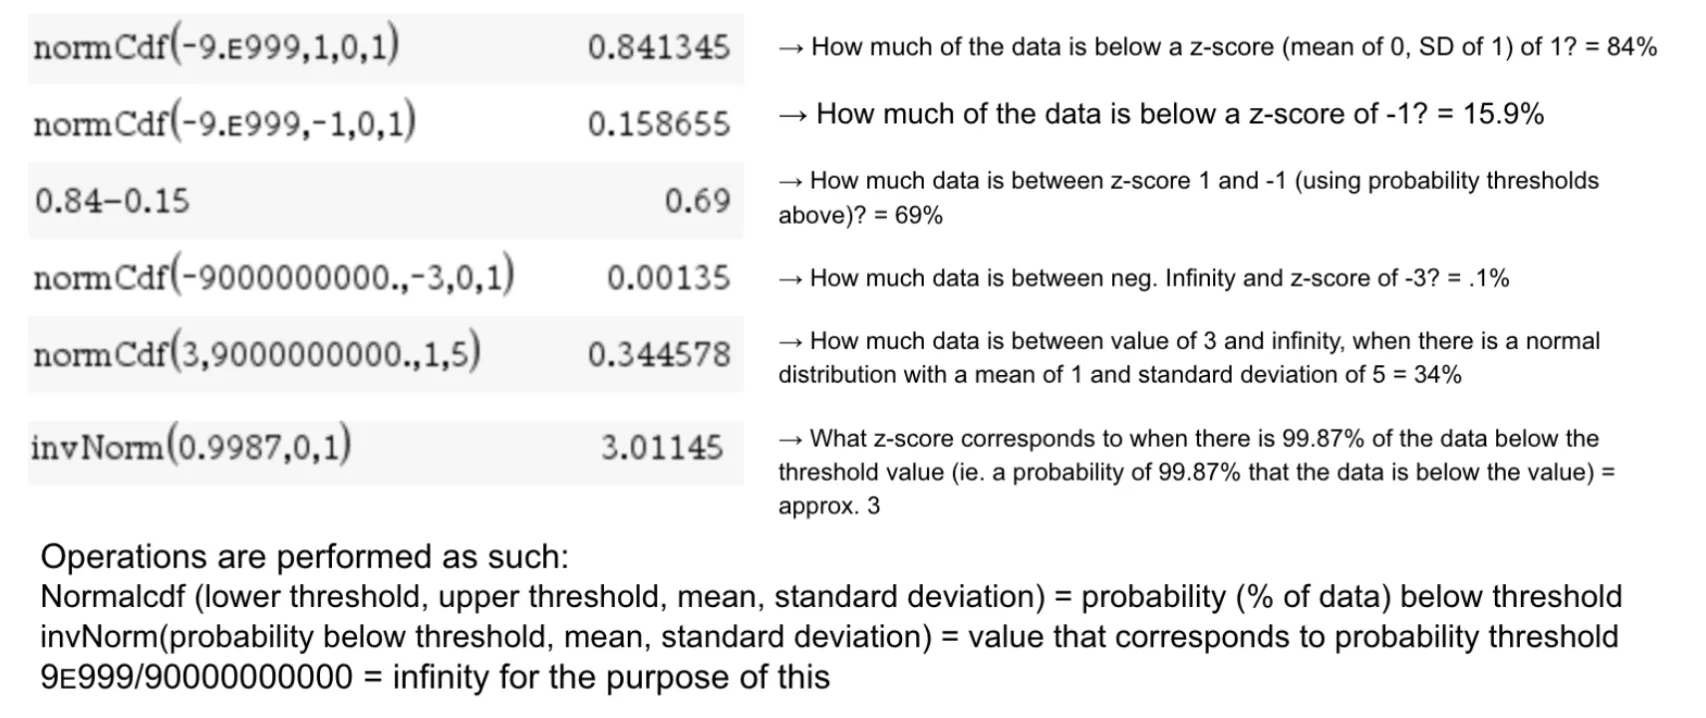
We can infer values within a normal distribution by using either the inverse normal operation or the normal cumulative distribution function (normalcdf / normcdf) operation. Normalcdf will determine how much of the data is below a certain threshold (the calculations below provide a decimal which can then be converted into a percent). Inverse Normal (InvNorm) tells you which z-score corresponds to a certain percent of data below that z-score in the normal distribution. (probability threshold).
With normalcdf, one must input the lower threshold and the upper threshold, as well as the mean and standard deviation of the distribution in order to find the percent of data within those values. The calculator will typically spit out a decimal between 0 and 1, which can be interpreted as 0% and 100%.
With inverse normal, one must provide a value between 0 and 1 (i.e. 0% and 100% of the data), and the mean and standard deviation of the distribution to find the value at the upper threshold that of a range that would contain that amount of data.
Here are some example calculations of normalCdf and InvNorm. Note that these operations are hard to do without a scientific calculator.
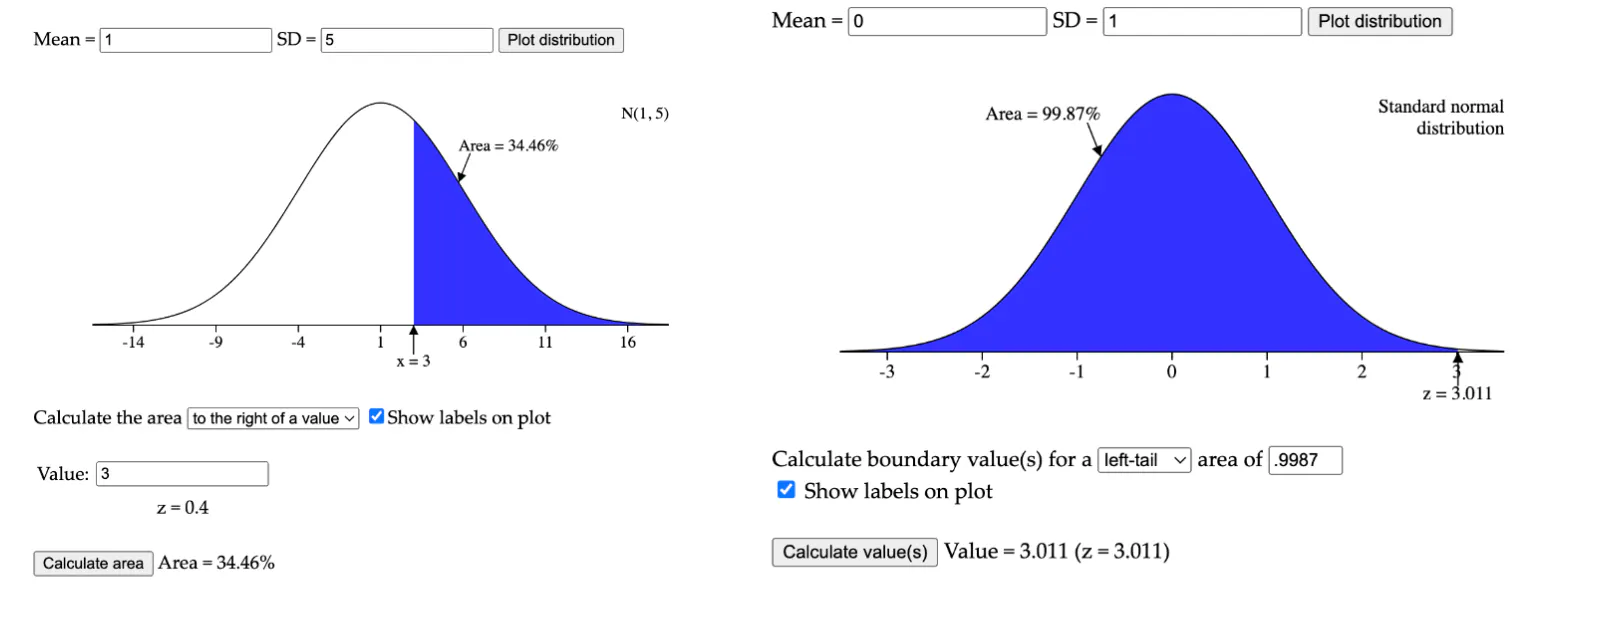
We can visualize a couple of the above operations as the following:
Ex: normalcdf(lower: 3, upper: pos. infinity, mean: 1, SD: 5) can be visualized as the left image. It confirms that 34.36% of the data (area) is above the value of 3 (at a z-score of .4).
Ex: invNorm(proportion of data below=.9987, mean= 0, SD = 1) can be visualized as the right image. It confirms that 99.87% of the data is below the value of 3.011, similarly given in the calculator.
Further reading
Did you enjoy this article?
Want to submit your own article? Reach out!
About The Author
Thomas is a student at Eastside High School.